Say It With Symbols: Finding Surface Area of Rod Stocks
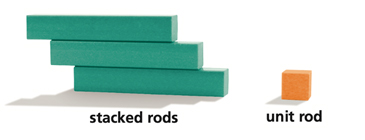
Students use digital Cuisenaire rods and find the surface areas of stacks of rods of certain lengths by varying the number of rods n. They describe a pattern and find the relationship between the number of rods n and the surface area of the stack A. The equation for the surface area is a linear relationship in terms of the number of rods used. Students will find that different but equivalent expressions can be used to model the data. You could include questions about volume by asking how many unit rods will be needed to build a stack of n rods of length x. Then ask the students to determine the function that can model this situation.
Materials Needed
- Access to an online Cuisenaire rod simulator such as one of the following: Modeling Fractions with Cuisenaire Rods or Math Playground Cuisenaire Rods
Adaptations and Notes
- Students need to be reminded that the digital versions of the rods are two-dimensional. They must consider all sides of the shape to find the surface area.
Possible CCSS
Grade 7
Ratios and Proportional relationships 7.RP
Analyze proportional relationships and use them to solve real-world and mathematical problems.
2. Recognize and represent proportional relationships between quantities.
a. Decide whether two quantities are in a proportional relationship, e.g., by testing for equivalent ratios in a table or graphing on a coordinate plane and observing whether the graph is a straight line through the origin.
Expressions and Equations 7.EE
Use properties of operations to generate equivalent expressions.
2. Understand that rewriting an expression in different forms in a problem context can shed light on the problem and how the quantities in it are related.
Solve real-life and mathematical problems using numerical and algebraic expressions and equations.
4. Use variables to represent quantities in a real-world or mathematical problem, and construct simple equations and inequalities to solve problems by reasoning about the quantities.
Grade 8
Functions 8.F
Define, evaluate, and compare functions.
1. Understand that a function is a rule that assigns to each input exactly one output. The graph of a function is the set of ordered pairs consisting of an input and the corresponding output.
2. Compare properties of two functions each represented in a different way (algebraically, graphically, numerically in tables, or by verbal descriptions).
3. Interpret the equation y = mx + b as defining a linear function, whose graph is a straight line; give examples of functions that are not linear.
Use functions to model relationships between quantities.
4. Construct a function to model a linear relationship between two quantities. Determine the rate of change and initial value of the function from a description of a relationship or from two (x, y) values, including reading these from a table or from a graph. Interpret the rate of change and initial value of a linear function in terms of the situation it models, and in terms of its graph or a table of values.
5. Describe qualitatively the functional relationship between two quantities by analyzing a graph (e.g., where the function is increasing or decreasing, linear or nonlinear). Sketch a graph that exhibits the qualitative features of a function that has been described verbally.