Data Projects in the time of distance learning
The original project for the Data About Us unit suggests that students follow the statistical process of 1) posing questions, 2) collecting data, 3) analyzing data, and 4) interpreting results. The limitations of distance learning restrict students’ ability to do the first two parts of the process. This project ideas focuses on the analyzing data and interpreting results.
Resources needed included students' access to Pearson Realize "Data and Graphs" Tool
You may want to focus on the project adding specific questions for students to answer as they interpret the results after analyzing the data. Some examples of questions are given below.
A Modification of the Statistical Process
Step 1: Posing Questions
Students do not pose questions. You might offer students a choice of which data set to choose. Sample questions asked when collecting the data are listed below.
Step 2: Collecting the data
Actual data is embedded in the Data and Graphs Tool.
Step 3: Analyzing the data
Once students have the data, they should organize and display the data. They should decide which displays and which measures of center and spread are best to report for each set of data.
Step 4: interpreting the results
After the data have been analyzed, students should interpret the results and present it in some way. They can write a report or make a poster to show their findings. The presentation should include their survey questions, information about how the data were collected, appropriate data displays and measures of center and spread, and concluding statements about what is typical about their survey population.
If you create the survey as a class and assign one question to each group, you will want to come together as a class to discuss the results and assemble the characteristics of a typical student.
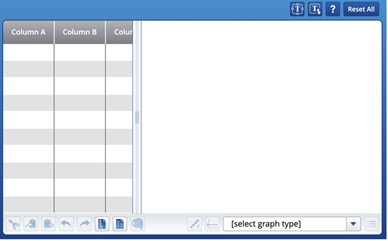
DATA SETS EMBEDDED IN THE DATA AND GRAPHS APP ON PEARSON REALIZE
The tool has data sets embedded into the tool. To find the data, go to the bottom menu bar. There is an icon that looks like a two-column piece of paper.
Once you choose the sample data, you will have choices of the data that you want to use.
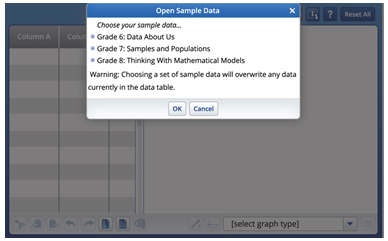
Each Unit has a few data sets.
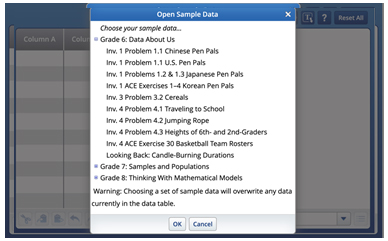
Grade 6: Data about us
Inv. 3 Problem 3.2 cereals
- What is a serving size?
- How many grams of sugar in a serving?
- How many calories in a serving?
- How much sodium (salt) in a serving?
- Where is the cereal located on the shelf?
Inv. 4 Problem 4.1 Traveling to School
- How long does it take for you to get to school?
- What distance do you travel?
- How do you get to school (mode of travel)?
Looking Back: Candle-Burning Durations
- Which candle lasts the longest?
- (Data gives the results of 15 trials for three types of candles with the brand names: Brilliant, Firelight, and Shimmering.)
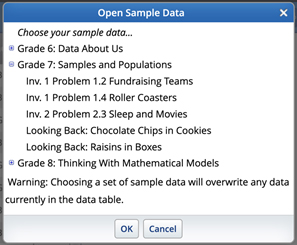
Grade 7: Samples and Populations
Inv. 1 Problem 1.4 Roller Coasters
- When did the roller coaster open in an amusement park?
- What is the largest height of dropping (maximum drop in feet) on the ride?
- How tall is the tallest part of the roller coaster (maximum height in feet)?
- How long is the roller coaster (track length in feet)?
- How fast does the roller coaster go (top speed in miles per hour)?
- How long is the ride (duration in minutes)?
- From what material is the roller coaster made (type)?
Inv. 2 Problem 2.3 Sleep and Movies
- What is the gender of the person answering the question (boy or girl)?
- How many hours of sleep did they get the night before answering the survey?
- How many movies did they watch in the week before answering the survey?
Looking Back: Chocolate Chips in Cookies
- How many chocolate chips are in a cookie?
(Data gives the results of 25 trials from four different classroom analyzing how many chocolate chips were in cookies. Each trial from a class is from the same brand of cookie. However, the classes did not necessarily test the same brand of cookie. For example, Class 1 may have done trial from 25 Chip Ahoy while Class 2 tested 25 Keebler Chips Deluxe.) - Does is seem that the four classes were looking at the same kind of chocolate chip cookies?
Looking Back: Raisins in Boxes
- What is the brand of raisins (Brand X and Brand Y)?
- How many raisins in a snack box?
- How much does the snack box weigh?
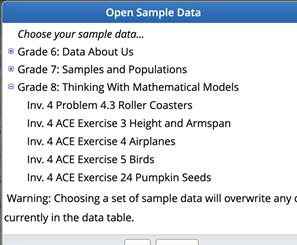
Grade 8: Thinking with Mathematical Models
Inv. 4 ACE Exercise 4 Airplanes
- What is the type of plane (jet or propeller)?
- How many engines does it have?
- What is the length of the jet (meters)?
- How long are the wings (wingspan in meters)?
- What is the ratio of wingspan to length of the plane?
Grading
A suggested scoring rubric and two sample projects with teacher comments follow. The first sample is a report; the second is a story.
Suggested Scoring Rubric
This rubric for scoring the project employs a scale that runs from 0 to 4, with a 4+ for work that goes beyond what has been asked for in some unique way. You may use the rubric as presented here or modify it to fit your district’s requirements for evaluating and reporting students’ work and understanding.
4+ Exemplary Response
- Complete, with clear, coherent explanations
- Shows understanding of the mathematical concepts and procedures
- Satisfies all essential conditions of the problem and goes beyond what is asked for in some unique way
4 Complete Response
- Complete, with clear, coherent explanations
- Shows understanding of the mathematical concepts and procedures
- Satisfies all essential conditions of the problem
3 Reasonably Complete Response
- Reasonably complete; may lack detail in explanations
- Shows understanding of most of the mathematical concepts and procedures
- Satisfies most of the essential conditions of the problem
2 Partial Response
- Gives response; explanation may be unclear or lack detail
- Shows some understanding of some of the mathematical concepts and procedures
- Satisfies some essential conditions of the problem
1 Inadequate Response
- Incomplete; explanation is insufficient or not understandable Shows little understanding of the mathematical concepts and procedures �� Fails to address essential conditions of problem
0 No Attempt
- Irrelevant response
- Does not attempt a solution
- Does not address conditions of the problem